NSM Archive - Aluminium Gallium Arsenide (AlGaAs) - Band structure and carrier concentration

Band structure and carrier concentration
Basic ParametersTemperature Dependences
Dependence on Hydrostatic Pressure
Energy Gap Narrowing at High Doping Levels
Band Discontinuities at AlxGa1-xAs/GaAs Heterointerface
Basic Parameters
| Energy gap |
x<0.451.424+1.247x eV x>0.451.9+0.125x+0.143x2 |
| Energy separation (EΓL) between Γ and L valleys | 0.29 eV |
| Energy separation (EΓ) between Γ and top of valence band | 1.424+1.155x+0.37x2 eV |
| Energy separation (EX) between X-valley and top of valence band | 1.9+0.124x+0.144x2 eV |
| Energy separation (EL) between L-valley and top of valence band | 1.71+0.69x eV |
| Energy spin-orbital splitting | 0.34-0.04x eV |
| Intrinsic carrier concentration |
x=0.12.1·105 cm-3 x=0.32.1·103 cm-3 x=0.52.5·102 cm-3 x=0.84.3·101 cm-3 |
| Intrinsic resistivity |
x=0.14·109 Ω·cm x=0.31·1012 Ω·cm x=0.51·1014 Ω·cm x=0.85·1014 Ω·cm |
| Effective conduction band density of states |
x<0.412.5·1019·(0.063+0.083x)3/2 cm-3 x>0.452.5·1019·(0.85-0.14x)3/2 cm-3 |
| Effective valence band density of states | 2.5·1019·(0.51+0.25x)3/2 cm-3 |
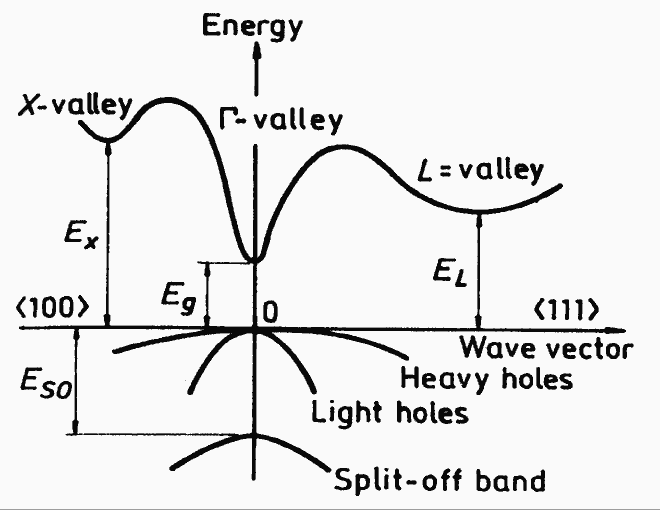 |
Band structure AlxGa1-x for x<0.41-0.45. Important minima of the condition band and maxima of the valence band |
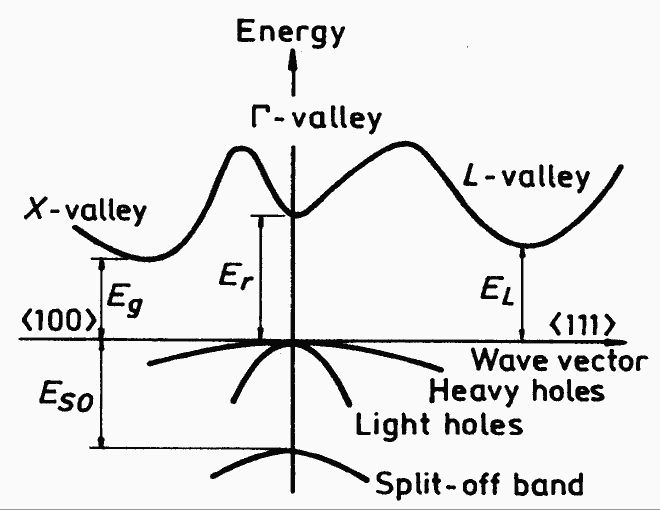 |
Band structure AlxGa1-x for x>0.45. Important minima of the condition band and maxima of the valence band |
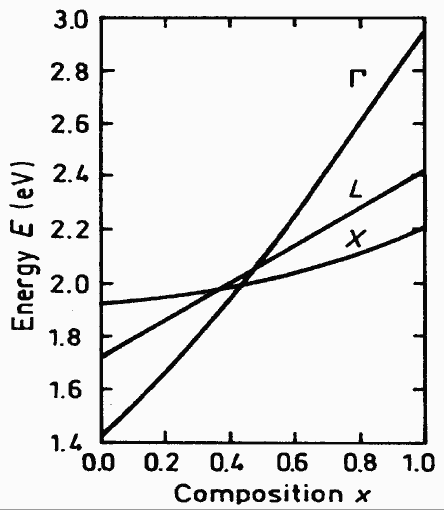 |
Energy separation between Γ-, X-, and L- conduction band minima and top of the valence band versus composition. Crossover points:
|
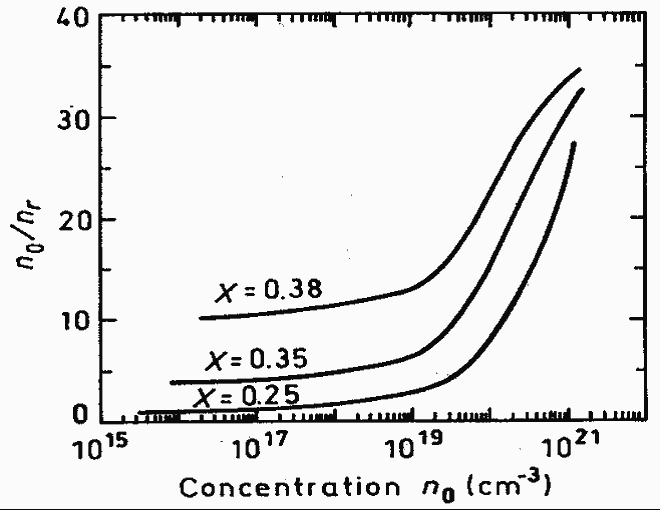 |
Ratio of the total carrier concentration to the carrier concentration in Γ-valley as a function of equilibrium carrier concentration at 300K (Zarem et al. [1989]). |
Temperature Dependences
To estimate the temperature dependences of energy difference between the top of the valence band and the bottom of the Γ, X, and L valleys of the conduction band EΓ, EX and EL one can use the data for GaAs (Aspnes [1976]).EΓ=EΓ(0)-5.41·10-4·T2/(T+204) (eV)
where EΓ(0)=1.519+1.155x+0.37x2 (eV)
EX=EX(0)-4.6·10-4·T2/(T+204) (eV)
where EX(0)=1.981+0.124x+0.144x2 (eV)EL=EL(0)-6.05·10-4·T2/(T+204) (eV)
where EL(0)=1.815+0.0.69x (eV)Temperature dependence of the energy difference between the top of the valence band and the bottom of the L-valley of the conduction band
EL=1.815-6.05·10-4·T2/(T+204) (eV)
Temperature dependence of the energy difference between the top of the valence band and the bottom of the X-valley of the conduction band
EL=1.981-4.60·10-4·T2/(T+204) (eV)
Effective density of states in the conduction band Nc
X<0.41 Nc=4.82·1015·(mΓ/mo)3/2·T3/2 = 4.82·1015·T3/2·(0.063+0.083x)3/2 (cm-3)X>0.41 Nc=4.82·1015·(mcd/mo)3/2·T3/2 = 4.82·1015·T3/2·(0.85-0.14x)3/2 (cm-3)
where mcd is effective mass of the density of states;
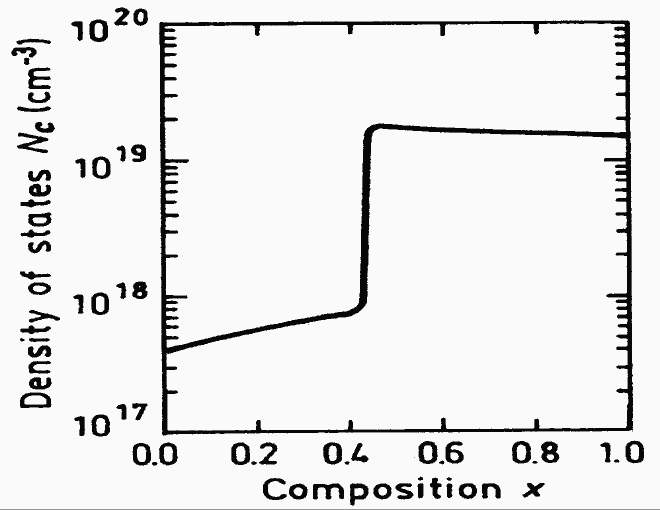 |
Effective density of states in the conduction band versus x. (Calculated) |
Effective density of states in the valence band Nv
Nv = 4.82·1015·T3/2·(0.51+0.25x)3/2 (cm-3) X>0.41 Nc=4.82·1015·(mcd/mo)3/2·T3/2 = 4.82·1015·T3/2·(0.85-0.14x)3/2 (cm-3) |
Effective density of states in the conduction band versus x. (Calculated) |
Intrinsic Carrier Concentration
ni = (Nc·Nv)1/2exp[-Eg/(2kbT)]
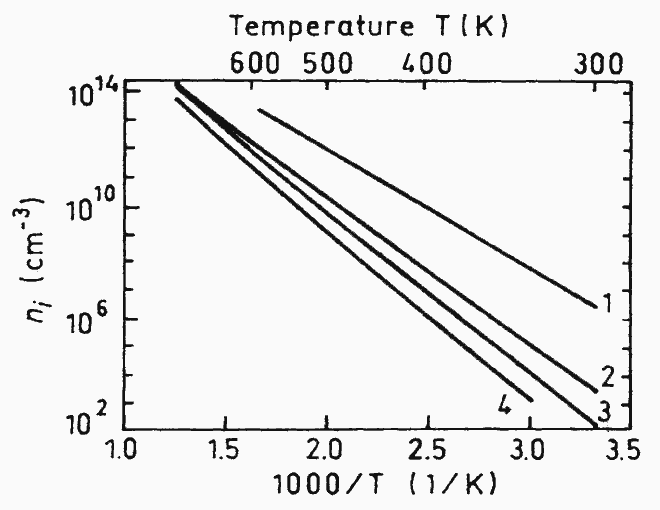 |
The temperature dependences of the intrinsic carrier concentration. 1. x=0 2. x=0.3 3. x=0.6 4. x=1 |
Dependences on Hydrostatic Pressure
EΓ = (11.5 - 1.3 x)·10-3·P (eV)EX = -0.8·10-3·P (eV)
EL = 2.8·10-3·P (eV)
where P is pressure in kbar. (Adachi [1985])
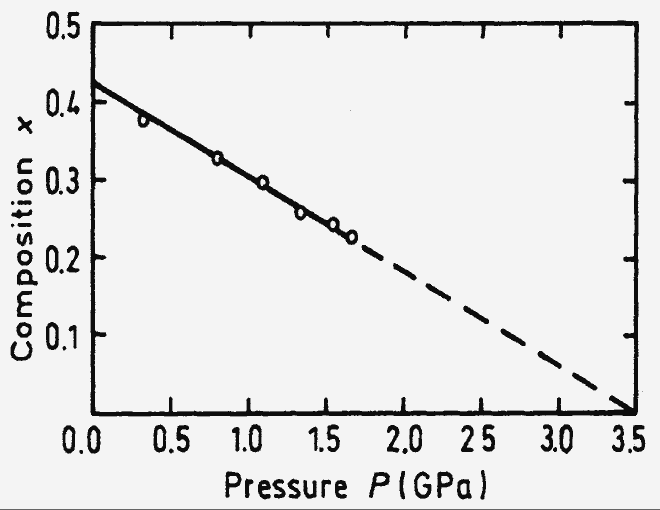 |
Pressure dependence of the Γ-X crossover. 300 K (Saxena [1980]) |
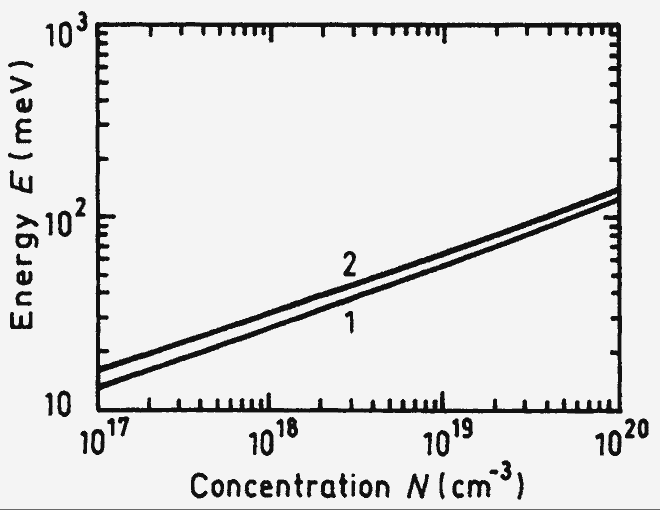
Energy Gap Narrowing at High Doping Levels
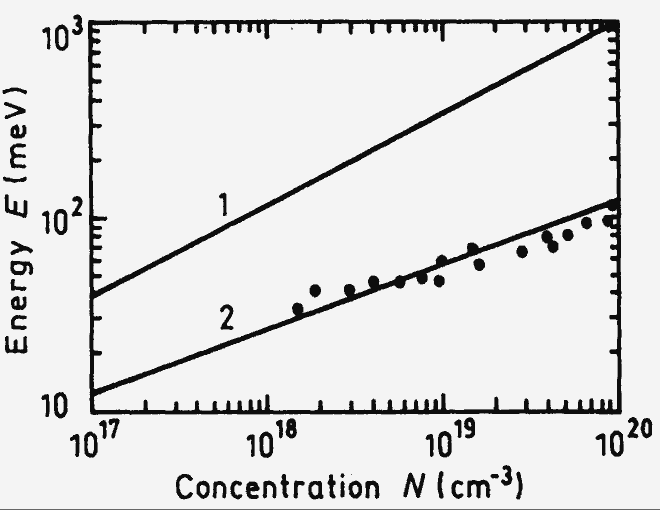 |
Energy gap narrowing versus donor(curve 1) and acceptor (curve 2) doping density for GaAs (x=0). Experimental points for p-GaAs are taken from four different papers (Jain and Roulston [1991]) |
 |
Energy gap narrowing versus donor (curve 1) and acceptor (curve 2)doping density for AlAs (x=1). The curvesare calculated according (Jain et al. [1990]) |
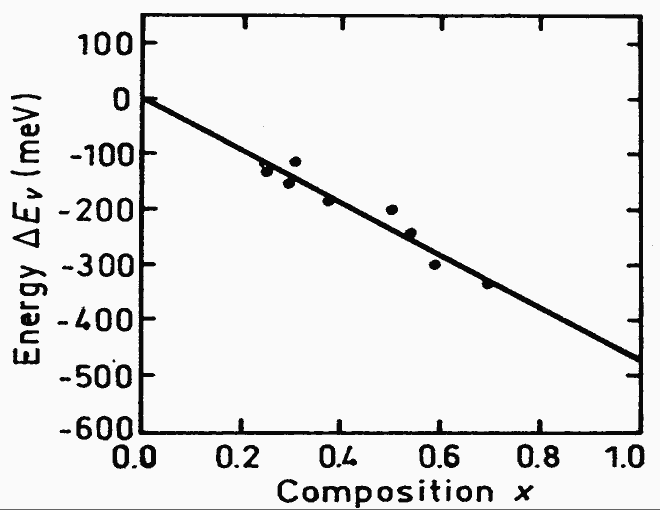
Band Discontinuities at AlxGa1-xAs/GaAs Heterointerface
Valence band discontinuity:
ΔEv = - 0.46x (eV)Conduction band discontinuity:
x<0.41 ΔEc = 0.79x (eV)x>0.41 ΔEc = 0.475-0.335x+0.143x2 (eV)
 |
Energy gap narrowing versus donor(curve 1) and acceptor (curve 2) doping density for GaAs (x=0). Experimental points for p-GaAs are taken from four different papers (Jain and Roulston [1991]) |